In order to generate a 40+% positive return in one quarter, you need a combination of occurrences:
- Analytical and trading capabilities that are repeatable, reliable and scalable
- Volatility – you simply cannot generate returns of that scale in a relatively brief period of time without significant volatility (unless you’re being careless with leverage)
- A proper understanding of the global macroeconomic environment and its effect across all asset classes
- A little bit of luck – at least as it relates to the timing of Trump tweets
All four factors were instrumental in our first quarter of 2026, though the last one was a bit tongue in cheek (and obviously the least meaningful contributor to our performance). A few highlights:
- I felt WTI was incredibly undervalued at the onset of the year when it was trading in the mid-$50s; I was very long accordingly. I did not see it doubling in the quarter, but it was not surprising given the geopolitical tone of the current administration. I do believe we are more likely from here to see a sustained period <$80 rather than $125+, but I also believe we will not see <$60 for a long time, absent a global recession/depression.
- Alternative energy sources, particularly linked to AI investments, had a wonderful January, notably uranium-linked equities.
- As the calendar flipped to February, we noticed defensive sectors (particularly consumer staples and energy) were attracting sizable interest from the buyside at the expense of higher beta stocks and tech sectors. Many thought that was constructive – a “broadening” of the market. We had the opposite view and began taking long theta, asymmetric positions when volatility was cheap, preparing for the inevitable pullback.
- Crypto’s inability to find a durable bottom, coupled with the unprecedented volatility in gold and silver, convinced us that volatility would inevitably bleed to the equity market, simply needing events and/or time to occur. The response to Nvidia’s earnings in late February convinced us we were right, and the attack on Iran rewarded us handsomely.
- Our asymmetric positions in the S&P 500, consumer staples, and small caps drove a significant majority of our performance in Q1. But core longs in energy – both oil and natural gas – were meaningful contributors.
With that pleasant summary behind us, what do we envision for Q2? While I do not have conviction in nearly every asset I follow at the moment, I still do have strong convictions in a trading market, not an investing market.
- I believe this rally towards/above the all-time highs in many equity indices, notably SPX and NDX, is a trap and will lead to a significant multi-month top in May and result in materially lower lows in Q3/early Q4.
a. There are a number of technical reasons why I believe this, but I believe a combination of technicals, macroeconomic data, seasonality, geopolitics, and earnings will all conspire to give us this meaningful downward move later in the summer.
b. The “conflict” in the Middle East will wind down eventually, but the economic disruption globally and input price spike from a multi-week Hormuz shutdown is far more meaningful than current equity prices are making you believe. I also firmly believe the actions in Iran have accelerated the inevitable de-dollarization of the global energy market.
c. I also have significant concerns surrounding liquidity constraints in private credit, given the notoriety around redemptions YTD. There is an enormous refinancing wave of corporate credit in the next 24 months, and a net shrinkage of the corporate liquidity pool – coupled with an uptick in realized losses – could be significantly detrimental to market psyche, much like non-prime housing in 2006-2007. In the past few weeks, Federal Reserve regulators have reached out to both banks (their constituents) and state regulators (governing life insurance companies) regarding their exposures and risk management systems around private credit. These headlines are not going to recede, and a shrinking pool of net liquidity will inevitably create material problems in this asset class.
- I continue to be very cautious and concerned with capital deployment in any longer-term capacity. There is simply too much asymmetric risk, particularly with geopolitics and AI headlines, to make me believe this environment continues to justify a trading mentality. Rent the market, don’t own it.
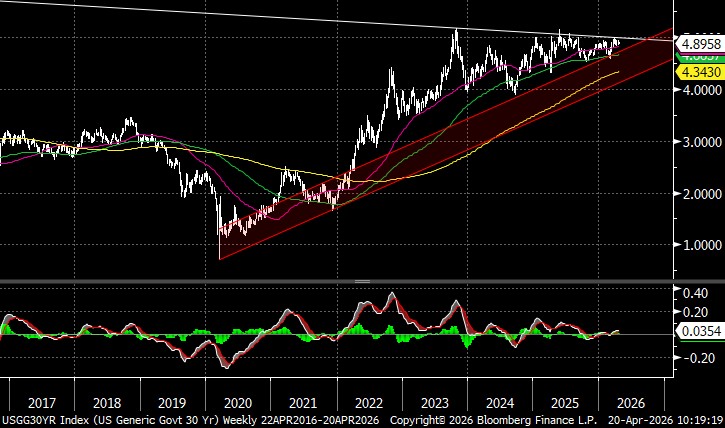
- Yields on 30 year UST near 5% should continue to be the ceiling, with ~4.25% the floor (absent a material risk off shock). But the chart is looking a little scary.
- There’s a significant rally coming in crypto before year end, I just don’t know when and where from. I can see it in the charts, but we need a catalyst.
I’ve been thinking a lot about the second and third order effects of the Iranian “conflict,” and I just don’t think many people appreciate the repercussions in the context of the broader economic backdrop.
Our current US economy is growing 2-4% per year at relatively maximum unemployment, with a very strong one-time tailwind from AI infrastructure buildout (similar to the late 1990s internet fiber buildout). It is equally clear our needs consistent US fiscal deficits of $2+ trillion to function this way, because that has been the case since COVID. Said another way, our economy needs $2+ trillion in non-organic and consistent stimulus to function at current trend, but even at that non-organic stimulus level, most everyone agrees that the growth trend has been decelerating as consumer financial statistics show a consumer very close to maxed out. That also assumes WTI between $60 and $80, where it has largely traded the past 3 years.
The problem with the oil spike isn’t the oil spike itself – the US economy has handled much higher gas prices historically, notably during Ukraine-Russia only 4 years ago. It’s the oil spike on top of everything else, namely what’s affecting the US consumer:
— significant increase in core non-discretionary expenses – not just household energy, but also healthcare, insurance, and food
— weakening job market with no significant relief forthcoming
— no/minimal wage growth, which is likely to continue given significant AI job displacements are both occurring and increasing
— broader economic uncertainty stemming from tariff uncertainty, not just input cost uncertainty from Hormuz closures
In my mind, when I think about inflation, I see it from a substitution effect and opportunity cost perspective. Inflationary shocks can only become broadly inflationary to the entire economy if there is an increase in net liquidity that offsets those inflationary effects. Otherwise, there must be substitutive offsets to balance the equation.
· For example: if a family projects to spend $10,000 on gas for the year but now has to spend $15,000, they need $5,000 in more net income, or they need to find $5,000 in debt or savings elsewhere. That can be anywhere – less discretionary purchases, money pulled from investments, credit cards, anything.
· There are anecdotes that support this just in the past few weeks – as gas prices increased above $4 nationwide, many gas station stores reported decreased purchases of overall goods in addition to substitutive purchases of cheaper brands, e.g. knock off cigarettes instead of Marlboro Reds.
Now, factor into the equation this is happening amidst the entire broader picture:
1. Private credit liquidity concerns are increasing materially, and experience teaches us once the train leaves the station, it doesn’t turn around and come back easily;
2. Default/delinquency rates in commercial real estate and other consumer assets are elevated and increasing; AND
3. The Federal Reserve is hamstrung from providing materially more liquidity (i.e. QE) and/or materially lower rates out of concern of inflation. The inflationary effects of the Hormuz closure will take weeks and months to play out, just like tariffs, but they are going to be material in key areas – as Dennis Gartman used to say, “inflation in the things you need, deflation in the things you want.” Food prices later in the year are going to be materially more expensive because prices on fertilizer are through the roof, and that assumes the fertilizer itself is even available for purchase.
Where will all of this necessary external net liquidity come from? Historically the US government would be a provider of new net liquidity in the form of fiscal relief – but I doubt we’ll see that at any point over the next 3 years given the political dynamic in DC. And if real wage gains aren’t going to outpace inflation – and they never do – those needs will come from an increase in debt or a decrease in savings. And credit card usage has to be near some form of a peak, right?
It’s not hard to see how this can snowball. It’s also why I’m not worried about systemic inflationary pressures just yet – the US economy isn’t strong enough to handle it and actually push inflation through the broader economy. It will take months for this to play out, but if net liquidity continues to tighten the way it has, there simply isn’t much of a safety net.
A few charts that illustrate these thoughts:
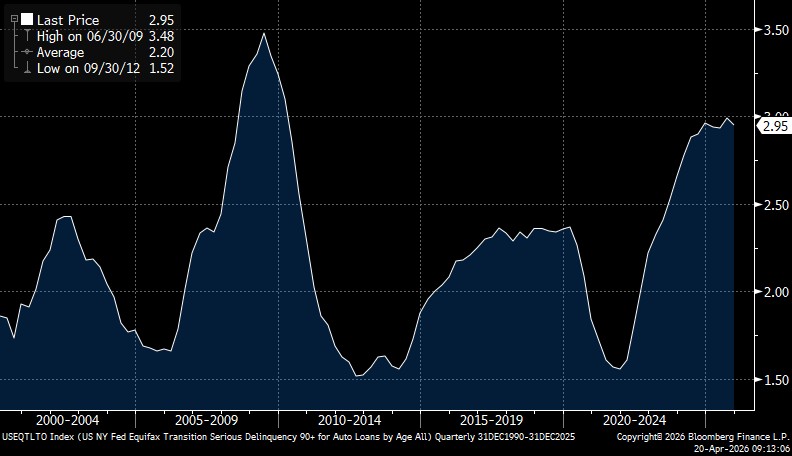
- 90+ Day Auto Loan Serious Delinquency designation has plateaued at levels we haven’t seen since the GFC. I’m waiting for someone to explain to me how an economy operating at full employment with multi-decade highs in auto loan delinquencies resolves favorably.
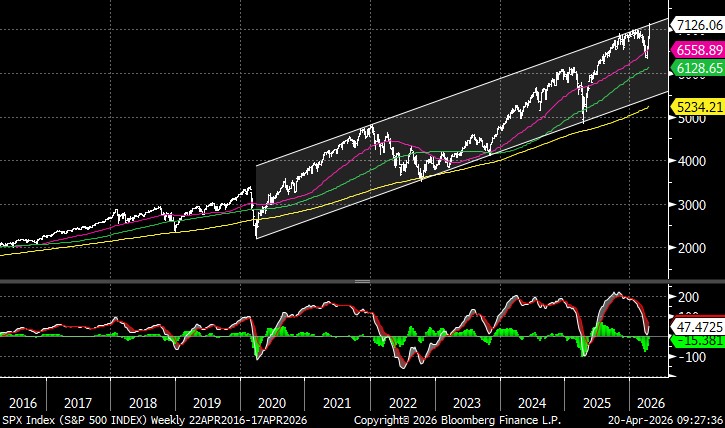
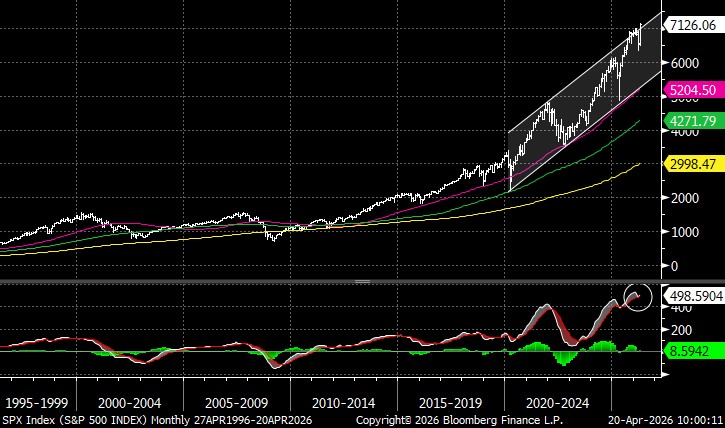
- The post-COVID trend channel in SPX has held on both ends for 6 years. Bulls are sitting at the top of the channel after one of the most ferocious rallies in history (not hyperbole). Are we really going to break through this so easily? Color me very skeptical. Monthly is also starting to rollover, which doesn’t mean a longer-term top is in, but it does mean the momentum higher is losing its push. Gut tells me we touch the lower part of the channel before the end of the year.
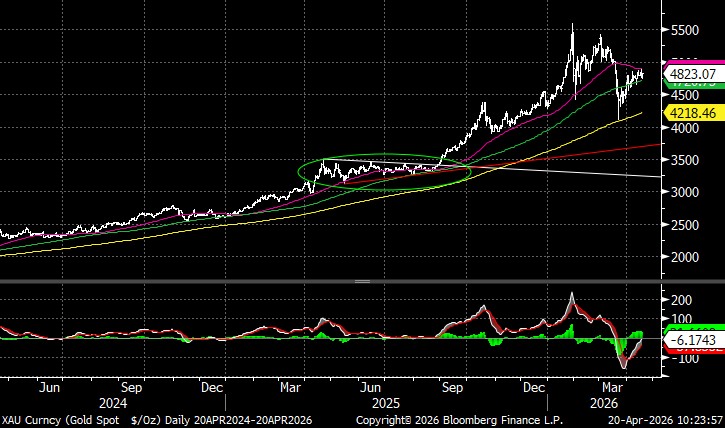
- 30 year UST yields have been compressing and range bound the past ~4 years, stuck between ~4% and 5%, despite a continually deteriorating fiscal position. Remember last year when I highlighted the multi-month triangle pattern in gold, suggesting a breakout or breakdown would be significant? 30 year USTs have been doing this for 4 years… imagine a breakdown in the UST market that would lead to a move in 30yr USTs above 5.50%… Or a massive economic growth shock that takes us back towards 4.25%… because it sure looks like the charts are telling us that.
I’m going to keep a close eye on the UST market the next few months. Starting to think that may be the squeaky hinge that eventually causes the whole door to fall off…