
Before we get to any assessments, suppositions, conclusions, and/or prognostications, I thought it appropriate to create my Top 10 list of current statistics and facts that have no qualitative factors attached to them.
In no particular order…
1. In the past 10 years, US Federal Debt has grown from ~$19 trillion to $40+ trillion. Since COVID, the US has run annual federal budget deficits (as a % of GDP) of 14.9%, 11.9%, 5.4%, 6.2%, 6.4%, and 6.3%.
2. According to FRED data from the Bureau of Labor Statistics, the CPI for food at home — groceries — rose 37.9% between January 2020 and March 2026. And no, this does not account for shrinkflation dynamics – e.g. a bag of chips that used to be 16 ounces now weighs 13.5 ounces.
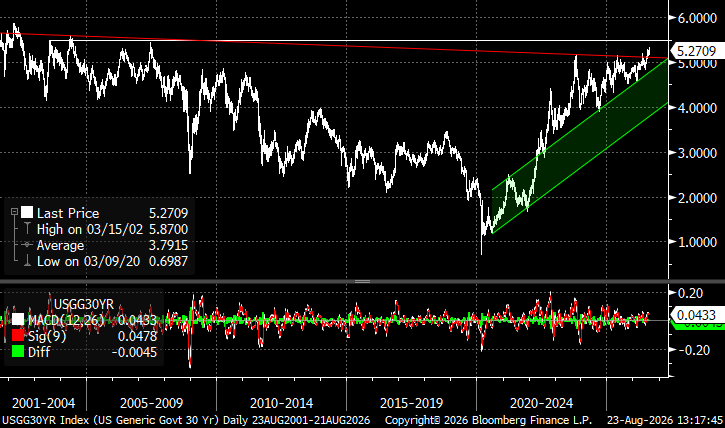
3. Despite Scott Bessent’s best efforts, the 30 year UST yield closed at ~5.27% on Friday, its highest weekly closing yield in nearly 20 years.
4. Serious 90-day delinquencies on auto loans sit at ~3%, the highest readings in nearly 30 years excluding the 2008-2009 financial crisis.
5. The US U6 index (commonly referred to as the underemployment rate) is 7.90%, ~140 basis points above the all-time low established in 2022 but also well below the rolling 200 month average of ~10.5%.
6. Free cash flow projections for Google, Microsoft, Meta, Amazon, and Oracle are projected to deteriorate from ~$0 in 2026 to negative ~$100 billion. Between 2019 and 2025, the lowest combined FCF for these 5 companies was positive ~$120 billion in 2022 and peaked at $234 billion in 2024 (source: Washington Post).
7. Current P/Es for Russell 2000 are ~38.5 and profit margins sit near all-time highs of ~14% (source: Yardeni Research here).
8. According to CBOE (here), options volume has increased exponentially since COVID, rising from ~$4 billion of annual volume in 2019 to an estimate of $18.6 billion in 2026. 0DTE volume is up more than 46% YTD, and leveraged ETF AUM is up from ~$86.5 billion in early April 2025 to ~$212 billion (as of June 30, 2026).
9. The first month 321 crack spread for WTI Cushing Crude is ~$60 and only days removed from an ATH of ~$70. This is occurring as the Strategic Petroleum Reserve sits at an all-time low of ~293 million barrels, down ~30% in less than 6 months. This is all occurring as traffic through the Strait of Hormuz and Bab al-Mandab Strait continue to be down significantly YTD.
10. Hyperscaler credit spreads have widened significantly over the summer. Nvidia’s 2036 note, which was issued on 6/15 at T+50bps, is now ~40bps wide of new issue as of Friday 8/22. Broader investment grade corporate bond supply is up ~34%.
All data was sourced from Bloomberg unless otherwise noted.
Main conclusion? It seems to me that there is virtually NO margin of error for nearly all parties involved – long equity investors, G7 policy makers, US consumers, and AI funders.
Why?
- We are witnessing a generational capital expenditure expansion that is unrivaled in modern history, potentially only mirrored in scope by the internet buildout 30 years ago. The previously highlighted hyperscaler FCF dynamics are one anecdote, but you see the effects everywhere. This is occurring alongside a deglobalization movement that has been well underway for the past 10+ years, creating sustainable and self-reinforcing inflationary pressures in input prices, as well as an increasing shortage of net equity capital available for deployment. We had too much leverage in the global economy 2-3 years ago – the hundreds of billions in new leverage being created in real-time now is only exacerbating the instability in the system.
- Nearly all parties heavily involved in, or affected by, this capital expenditure boom in developed countries are free cash flow negative: public governments, private tech companies, and consumers. The only FCF positive consumers at the moment are limited to the upper income and/or baby boomer demographics, who are clearly benefitting from appreciating asset prices and leveraging those assets/cash flows.
- The conflict with Iran has created one of the most significant supply side shocks in history, generating enormous inflationary pressures on energy and other associated commodities (e.g. fertilizers, plastics). Front month WTI prices do not tell the story – diesel prices, crack spreads, and SPR draws paint a more draconian prospective environment for energy prices, inflationary pressures, and economic concerns. As I’ve highlighted previously, higher energy prices for consumers are almost entirely substitutive shocks because of their demand inelasticity – one can only cut back so much on energy usage. Diesel prices are approaching $6 again and refineries are working overdrive. How much longer can the status quo hold?
- All of these factors are forcing the FOMC to be pragmatically cautious/hawkish. Complicating this even further is the transition from Jerome Powell to Kevin Warsh. I personally think Kevin Warsh is likely the best FOMC Chairman we have had in 40+ years, but he has been dealt the worst deck of cards in the history of the FOMC. I applaud his efforts across the board: focus the fight on inflation, shrink the FOMC balance sheet to reduce the FOMC’s effect on markets, reduce the cadence of communication, and reconstitute the collection of data to actually rely on data that is relevant and more real-time. Unfortunately, these goals are going to clash with market participants in the weeks and months to come.
- Bond markets appear to be fully aware of the FCF negative problem of so many of these entities. US Treasury yields are sitting at multi-decade highs and recently issued MAG7 bonds have widened materially, all while non-paper monetary assets have exploded of late (i.e. gold, silver, crypto). Private credit issues have been widely publicized and are worthy of our collective attention, but it is also worth following the potential for a “crowding out” effect of AI financing. High grade bond yields for AA and A rated non-financial credits north of 5% have been largely unheard of for decades – and yet you can buy 30 year META now at ~7%.
- In the spring of 2008, Bear Stearns collapsed into the arms of Jamie Dimon and JP Morgan. In the aftermath, many equity and credit investors believed the worst was over and eagerly “re-capitalized” the US banking sector with tens of billions of equity, preferred, and debt in April, May, and June. As those assets started to sour into the summer, the “crowding out” effect of those unrealized losses created significant angst across the entire credit spectrum and effectively shut down the market. I remember that entire dynamic vividly because I was an active participant in it. And I’d be lying if I said I wasn’t having a bit of déjà vu right now.
- Equity markets are pricing in both a continued historic expansion of revenues and sustainability of profit margins with PEs sitting near multi-decade highs. There is very little downside cushion, with net cash sitting near all-time lows, and a retail investor crowd that seemingly has shifted its investment philosophy to leveraged ETFs and options, which only exacerbate volatility.
- In many regards, none of this would bother me greatly if the macroeconomic picture was rosier. Unfortunately, we live in a US economy that also has very little downside cushion. Real GDP growth projections by most analysts hover in the 1.5-2.5% range for 2026 and 2027, even though the economy by all accounts is running at full employment with unprecedented fiscal stimulus and a historic infrastructure boom. And all we can muster is 1.5-2.5% real GDP growth…
- Consumer leverage has not improved while the equity markets have traded higher the past few years. Auto loan delinquencies, credit card usage, and the growth of “Buy Now, Pay Later” platforms paint a picture of a predominantly struggling and tapped out US consumer, except for the demographic sections noted above.
All that remains is the one thing we cannot control – time.
Time for inflationary and energy supply pressures to build, time for corporate margins to compress, time for confidence to ebb… just in time for a mid-term election.
The one true release valve to this thesis is a peace arrangement with Iran that results in a relatively immediate opening of Hormuz. Commodity prices broadly can begin to mean revert, inflationary pressures abate, geopolitics quiet down, UST yield and FX pressures abate, and confidence returns. It is not a panacea, but it has the potential to be significant in the near-term.
It is a non-zero probability, of course, and it will inevitably happen because the status quo cannot continue indefinitely without chaos and/or collapse. Will it happen before midterms? Will it happen before the markets force Trump’s hand? Only time will tell.
Technically speaking, I’d love to see some of the major US indices make one more all-time high in the next few weeks, particularly SPX and NYSE Composite.
I’m still more interested in other assets, though.
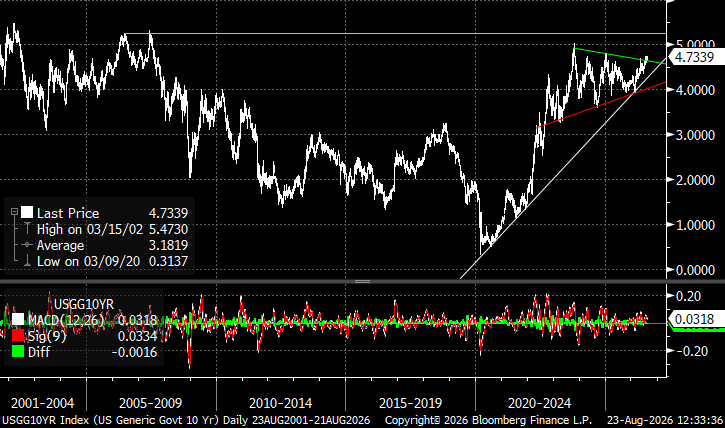
- Technically speaking, 10 year and 30 year UST yields simply don’t look “done” to me yet. Absent an Iran deal, I think 10s test 5% and 30s test 5.50% before too long. Bessent’s “emergency” QRA modification last week felt very similar to recent Japanese Yen interventions – a quick short squeeze and a very short half life. Pay attention to how the markets react to Warsh’s Jackson Hole speech on Friday… there is a part of me that thinks it may be eerily similar to the market reaction to Powell’s surprisingly hawkish 2023 speech.
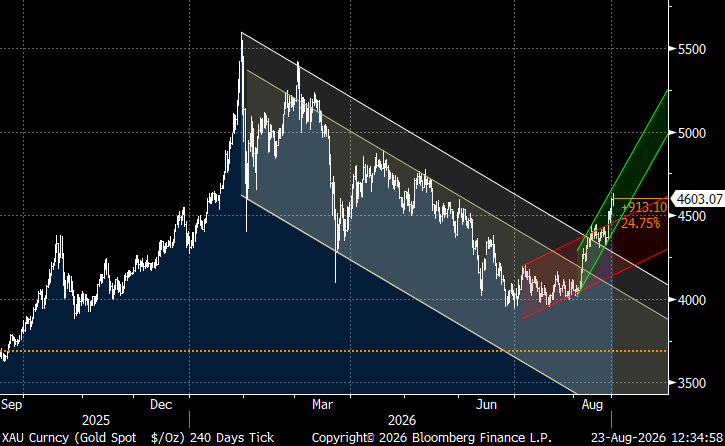
I wanted one more low in gold closer to $3800 but I’m beginning to believe we’ll never see that again. There is absolutely nothing in this chart that screams “materially lower prices” anytime soon.
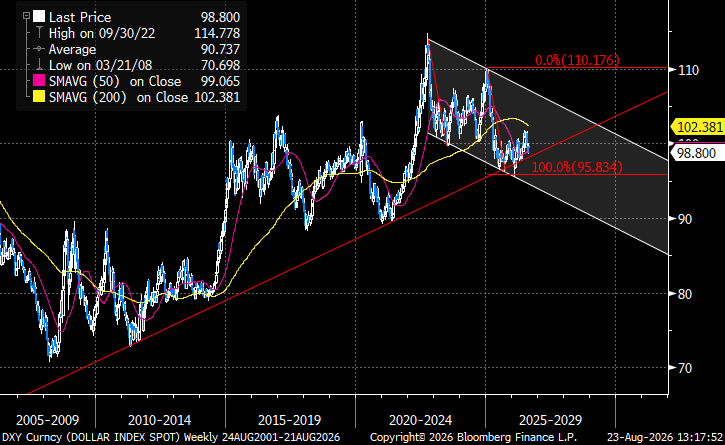
The one chart/asset that gives me the most anxiety right now is DXY, but I think its bullish from here.
- On one hand, you can easily talk yourself into a “Dollar Debasement” conspiracy theory and simply sell USDs against every asset out there for so many reasons previously mentioned.
- However… what other developed currencies in the DXY basket would you really want to own? JPY? EUR? GBP?
- Do you really think Kevin Warsh is going to stand by and allow commodity inflation to run rampant while the USD gets hammered by inflationary pressures? Zero chance.
- Technically speaking, we have a 15 year bullish trendline firmly in place, which was tested earlier in the year. From the September 2022 highs, we have a very clean Fibonacci retracement into the Q1 lows.
- I can very easily see a scenario unfold into Q4 where a hawkish FOMC steadfast in its mission to contain inflation creates a bullish market for the USD and we see the usual corresponding moves commence – risk assets sell off, volatility picks up, economic confidence wanes, global liquidity falters, and USTs rally… right into US midterm elections.
Gut tells me there’s a 10-20% correction in all risk assets in the next 3 months, and we’ll have a stronger USD, lower 10 year and 30 year UST yields, and materially lower equities ~75 days from now.
You can hold me to it.