Unprecedented.
That’s a word usually quite challenging to use when looking at historical market data points on any given trading day, and also a word that is overused incredibly and irresponsibly by both bulls and bears alike when trying to support a stance.
When it comes to financial stocks, however, the degree of relative strength since October is truly unprecedented, and not just in relation to itself, but in relation to everything.
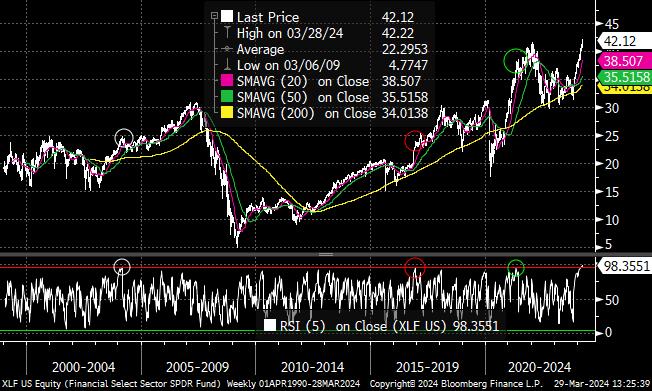
Allow me a moment to explain… the relative strength index (RSI) is generally considered a reasonably rudimentary calculation of strength/weakness in any particular asset, on a scale of 0 to 100. In general, a reading over 70 is considered strong, over 80 is overbought, over 90 is excessive, etc. XLF – a reasonably well-followed and moderately diversified basket of financial stocks encompassing insurance, banks, and non-regulated cash flow companies (e.g. V, MA) – currently is sitting at its highest weekly RSI in history over any measurement period (common measurement periods are 5, 9, 14, and 21). That in and of itself is impressive, but not wholly interesting.
What is interesting is how few assets in history are as overbought as XLF is right now, save individual meme stocks that have done silly things in the past handful of years (e.g. GME in 2021, SMCI earlier this year).
XLF’s weekly RSI, measured on a rolling 5 period basis, is sitting at 98.35. From a historical perspective…
· The NASDAQ Composite 1997-2000 runup/bubble had a peak reading of 96.42 in December 1999.
· 30 year US Treasuries have endured myriad crashes, both up and down, the past 20 years, including the 2008 financial crisis, the COVID crash into negative term rates, and the 2022-2023 bond bloodbath. And yet not even close to XLF current readings.
· The Swiss Franc, which rallied nearly 40% in ~14 months in 2010-2011 as the Greek debt crisis ramped and questions about Euro sustainability nearly took down the financial system, peaked at 93.85 in October 2010.
· The Pound Sterling, when George Soros shorted it in the early 1980s, peaked at 95.84 in June 1981.
· What about gold in the late 1970s and early 1980s? The US was in the midst of leaving the gold standard to fund the Vietnam conflict, stagflation was suffocating the US economy, and Paul Volcker was famously forced to raise the Federal Funds overnight rate to over 20% at times? Gold’s peak RSI in January 1980 was 98.35 – same as XLF now.
· Remember Chinese stocks from 2006-2007 in the runup to the Beijing Olympics in 2008? Now we’ve found one… 98.97 in December 2006. The Shanghai Composite almost tripled from there into November 2007, and then had one of the most spectacular crashes in history, dropping nearly 70% in ~13 months.
To me, the troubling part about all of these comparisons is they were either associated with enormously unstable bubble behavior or in the midst of significant financial crises. There’s clearly no crisis here at the moment (the notable exception being what the US government’s fiscal bubble is going to do to all of us in the coming years), and Jerome Powell’s continued insistence on a dovish tilt will probably ensure there is no crisis anytime soon. So any retrace in financial stocks is probably just an opportunity to buy. History of previous 95+ RSI readings would suggest a reconnect with the 20 week moving average (currently $38.51 and rising) is the absolute minimum requirement.
But we do live in very different times than years past because of the advent of 0 DTE options and the “short volatility as an asset” complex. Bears LOVED to chart margin debt and talk about “all-time highs” in margin debt when trying to build a case the market was too bullish. 0 DTE options have made margin irrelevant – I can take a position on $1mm worth of SPY notional for a few hours at a time with $1000 and a margin trading account. Doesn’t mean that account will be profitable, but market structure is so dramatically different now than it was even a year ago that historical comparisons are not only less relevant, but reactions to those historical comparisons are also probably less relevant. In all previous examples, nearly all of those peak readings simply led to 5-15% corrections in an ongoing trend that continued. But now? I don’t think anyone knows how stable the market is anymore, because we really haven’t seen it tested to the downside in today’s 0 DTE environment.
And that still begs the question – why financial stocks? AI and semiconductors I can absolutely understand. But CRE is a gigantic mess (and both banks and life insurance companies own a ton of CRE), consumer asset quality keeps deteriorating by the day even as it grows, the job market is clearly turning… why financials?
Interest Rates
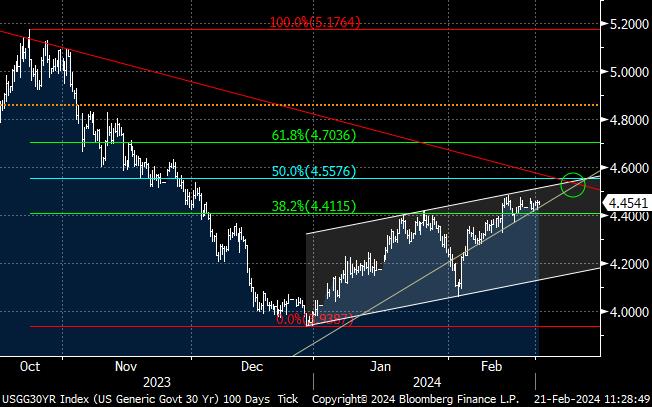
I still would like to see 30 year UST yields test the 4.50-4.60% complex that was bypassed during last year’s rally. Higher inflationary readings are very likely as some of last year’s softer readings roll off and higher commodity and input prices pressure current readings higher, but I’m not sure how much that matters. 30yr UST rates are as much a function of supply concerns and nominal GDP growth, and given the US fiscal deficit picture for the foreseeable future, it seems to me like we should test higher. But this isn’t terribly interesting at the moment, honestly.
Commodities
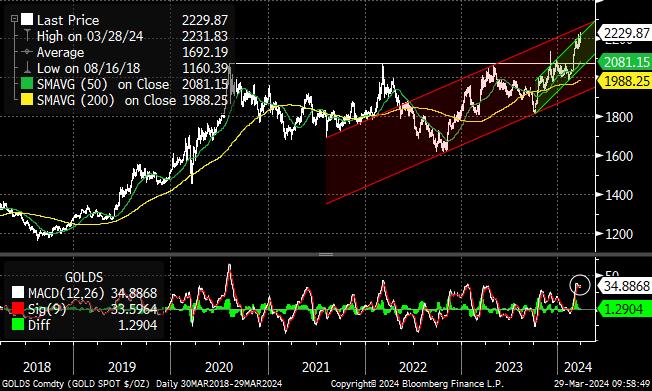
In January, I said there was no such thing as a quadruple top. Gold proved the case, quite spectacularly and decisively. There is nothing bearish about this chart or asset in the medium or long term, though the short-term is likely less bullish given the high daily MACD reading. I’d love to see gold reconnect with its 20 day and/or 50 day moving averages in the coming days/weeks to buy more…
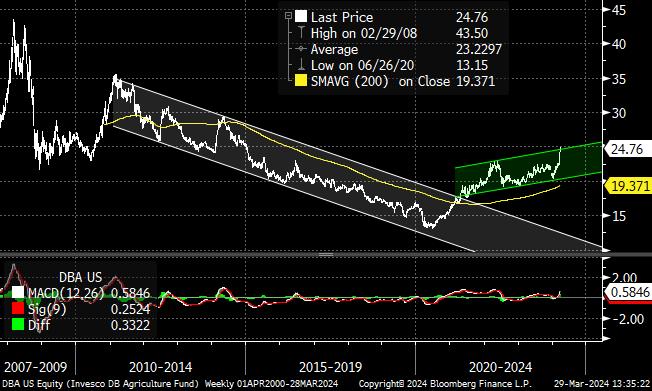
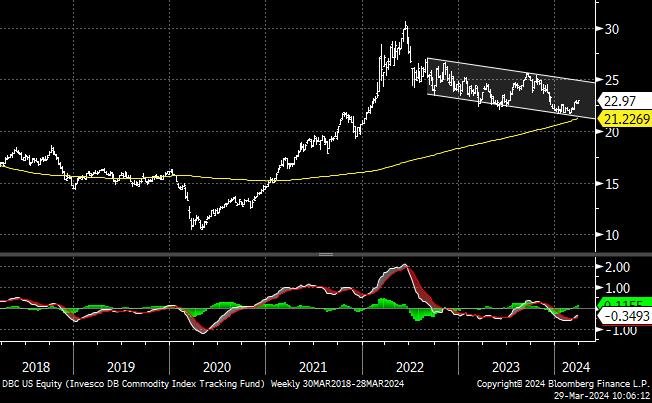
More broadly, commodities seem to be creating the type of challenges that should keep the FOMC up at night. The following charts are of DBA (agricultural commodities) and DBC (broad based commodities, but more energy and metals). DBA is skewed by the parabolic move in cocoa, but still tells a story of food and basic necessity inflation, while DBC certainly appears to have bottomed. Don’t be surprised if “stagflation” starts getting thrown around later this year, assuming these trends continue. We’ve been long DBC for the past few weeks and don’t see a reason to change that stance.
Equities
Equities have continued to defy most historical precedents and simply run or melt higher, depending on the week. The S&P 500 is up 18 of the last 22 weeks, which places it in rarified air over the past ~75 years. Previous time periods for comparative purposes:
· January 2018 – Trump 2017 tax legislation fueled this move. February 2018 saw the Volmageddon pullback, a higher high in October, and then an aggressive Jerome Powell led a ~20% correction into January 2019.
· February/March 1986 – resembles much of this run, honestly. The market bottomed in late September 1985 and ran higher through the end of March 1986. Markets then bounced down and up and ultimately sideways for the better part of 7 months, before one final run higher into the fall of 1987…
· September/October 1980 – interesting considering it was the immediate runup to the Reagan election (and 2024 is a similarly tumultuous Presidential election year). A quick 5% correction in early November ultimately saw one higher high in late November before a multi-year bear market ensued.
· April 1971 – market peaked in April 1971 after a nearly 50% rally off the May 1970 lows. Market corrected ~15% into November 1971, then had one final rally through the November 1972 Presidential re-election of Nixon (over George McGovern) before the crushing 1973-1974 bear market.
· The 1950s and 1960s bull markets – with the exception of July 1957, each of these runs ended with relatively sideways corrections over a period of months before ultimately resuming the bull market trend higher.
o Spring 1964
o Spring 1963
o Fall 1958
o July 1957
My observations from these historical time periods:
· Bull runs like these don’t normally end with immediate and major tops. I’m not expecting this one to be any different, especially given Jerome Powell seems bent towards dovishness and the fiscal irresponsibility is reaching epic proportions, which isn’t going to hurt markets in the short-term.
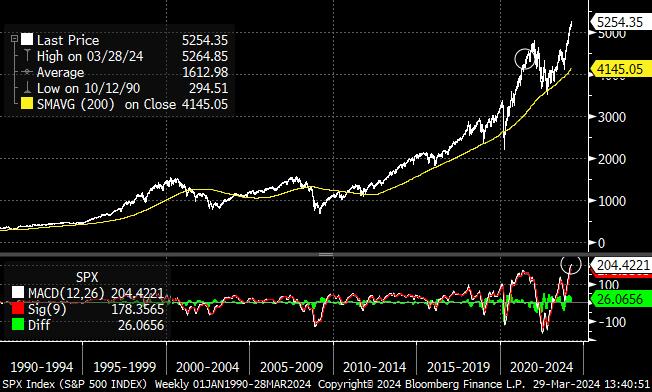
· Trading “sideways” for a sustained period of time seems both reasonable and likely, and history strongly supports that. We closed at ~5250 SPX on Friday, and it would not surprise me at all if we traded for the remainder of the year between 4750 and 5500. But I would be very surprised if we were up another 10-15% from here into the end of the year.
· If this market is healthy, we should see AT LEAST a 5-7% correction in the coming weeks. The daily MACD reading has long surpassed the previous highs in 2021, which vastly exceeded anything seen before in history (which furthers my point that this time in history is very different with regards to market structure). The peak daily MACD reading in May 2021 coincided with a swift 5% correction over a few weeks before continuing on to higher highs for another ~7 months. The higher we go without a correction, the more likely you set up crash conditions, so we should top *around here* this week. Earnings blackouts, a projected heavy capital gains tax payment bill (the cash needs to come from somewhere), and historically overbought technicals should provide enough of a reason for SPX to move from 5250-5300 down towards 5000 in the next 3-6 weeks. Below that, a reconnect with the 200 day moving average would not be surprising either, but we’ll take that day by day.
· Isn’t it interesting that the multi-year bull market moves in the 1990s and 2000s and 2010s are conspicuously absent? Nothing from 1995-1999, 2003-2007, or 2012-2015.
Energy, defensives, and commodities will be our long focus for the time being, with a heavy short concentration in financials.
I personally am looking forward to a far more volatile trading environment in Q2 – volatility can both be very fun and very profitable…