January 22, 2024 – Divergences Abound

With rare exception, divergences are a key requirement at longer-term inflection points – both tops and bottoms. The most relevant divergences occur across indices, other assets, advance-declines, and momentum. The more powerful the divergences, the greater the likelihood of the significance of the top or bottom.


We’re increasingly approaching that type of powerful inflection point. Current divergences may simply portend a reasonably brief and modest correction before more new highs. But this relatively relentless rally since October is getting quite long in the tooth.


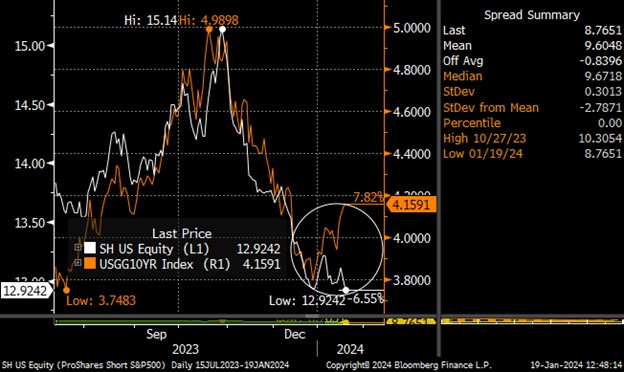
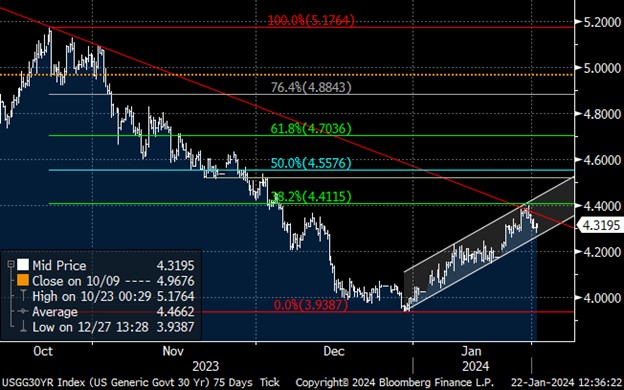
The price highs in December were highly unlikely to be “the” price highs for the major indices, simply because momentum was so strong (see my January 8 post with regard to INDU momentum) and nearly all indices and assets were in sync – i.e. the S&P 500, NASDAQ, Russell 2000, 10 year USTs, USD all made relative price highs/lows on December 28.


Fast forward a few weeks to new highs in the S&P 500 and NASDAQ, and how have some of those other assets performed?

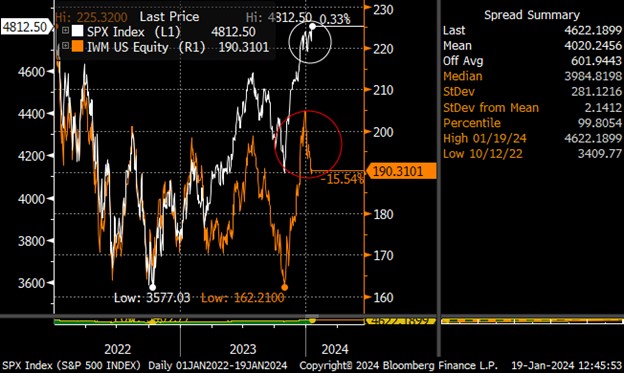
·         Russell 2000 – down ~4% YTD

·         10 year UST prices – down ~3% YTD

·         NYSE Composite – down ~2% YTD


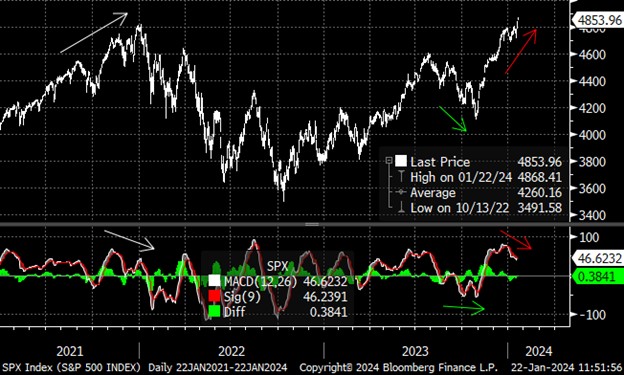
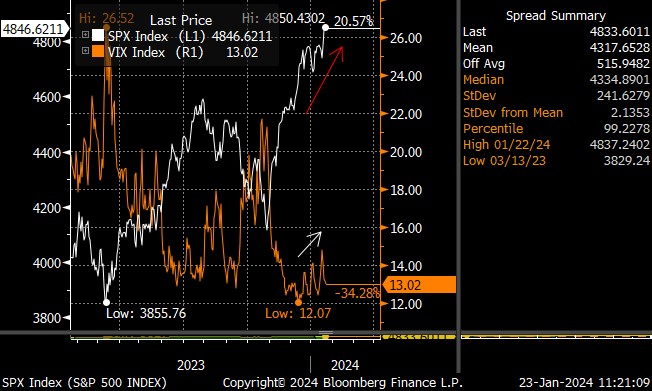
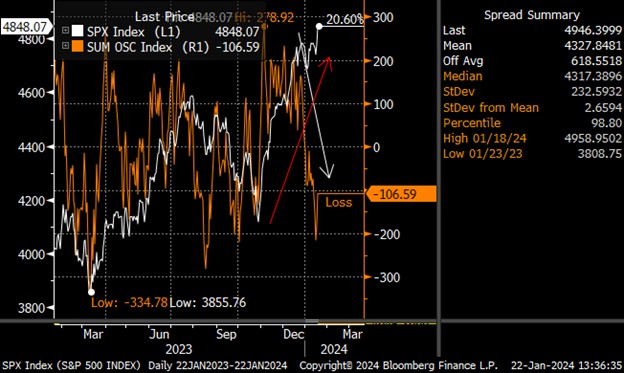
Beyond those cross asset divergences, we’re seeing divergences in volatility (higher lows and higher highs), advance-decline volume, and the McClellan Oscillator… which printed a number below zero on Friday 1/19 when both the S&P 500 and NASDAQ made new highs for the year. Not sure that’s happened before.


And this is all happening while China’s markets (including Hong Kong) are crashing, to the point Chinese authorities are tightening regulations around short selling and considering hundreds of billions of dollars worth of rescue packages for the stock market.


By no means do these divergences ensure prices are going to decline immediately, but it does mean the next correction may not be as simple as “BTFD.” Caution is certainly warranted up here.
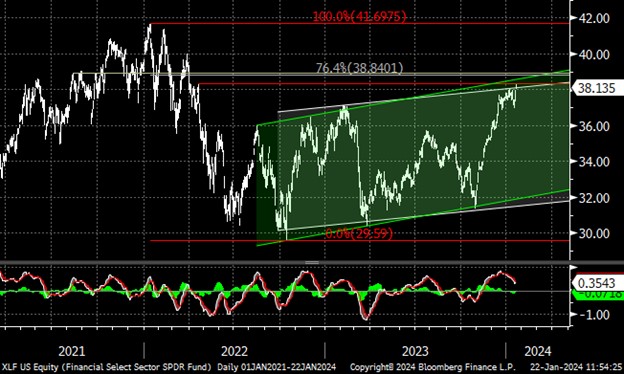
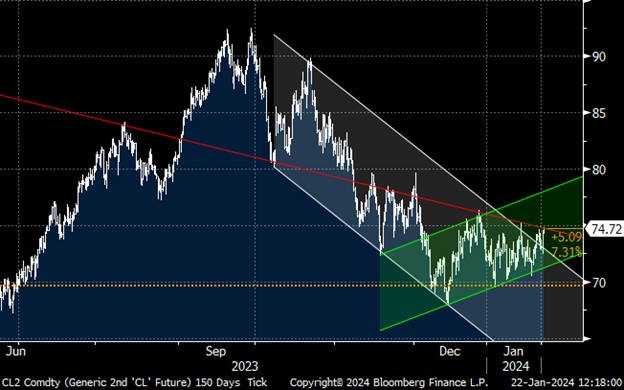
Equities

I’ll let the charts do the talking, since in many ways they are self-explanatory. Note the consistency of the momentum (MACD) divergences and the disparate performance across assets.

The McClellan Oscillator (“SUM OSC Index” on the Bloomberg chart, https://www.mcoscillator.com/) is a proprietary index that calculates an end of day reading based on advancing and declining volume as a way to measure market breadth. As this chart shows, Friday’s highs in both SPX and NDX occurred despite a negative oscillator reading, which just seems incredibly hard to fathom… how can major indices make new all-time highs with a breadth reading that is so poor that it is actually negative??! As the always well-spoken Northman Trader noted:

This chart is the inverse price of S&P 500 vs 10 year UST yields. 

Finally, XLF is sporting the type of longer-term divergences on the daily MACD chart that almost always occur at significant inflection points. Not only do we have the daily MACD divergence, but XLF has rallied straight into resistance at the top of some significant multi-year ranges… as we noted a few weeks ago, this will be one of our favorite shorts throughout the year.

Interest Rates

Last update noted:

“30 Year USTs found support at ~5% and showcased the type of positive divergence seen at market inflection points (previous ranges highlighted include 2003-2004 and 2017-2019), and then rallied 100bps in 2 months to the psychological 4% barrier. It seems sensible to us that we’ll see 30s range bound between ~3.50% and 4.40% for much of 2024, barring economic/geopolitical shocks or an inflationary spike. In the near-term, 4.20-4.25% is important support, a move higher could take us comfortably toward the 4.40% level where we would likely be buyers with both hands…”

Well, we touched 4.40% on Friday and rallied. Bond bulls need to hold that level or next line of defense is north of 4.50%. 

Commodities

WTI is compressing for a big move in the coming days/weeks. We’re pretty confident in either $80+ or <$70 in the next few weeks, and maybe both before the end of Q1. In all likelihood, it depends on which way the geopolitical winds blow. Global demand clearly doesn’t seem supportive of higher prices, so it requires some supply manipulation, disruption, and/or fear to get us there.
Gold is basing for a major move higher. Daily MACD needed some time (and price) to reset, which has largely been accomplished. Not sure when or what the catalyst will be (though I can surmise a few), but it’s coming. We’re staying patient until it becomes obvious. That quadruple top at ~$2075 isn’t likely to hold the next time it’s tested, and when it happens, it will be relatively breathtaking.

Happy trading.