As I was watching/participating in the trading action the past 72 hours, I couldn’t help but think of Ron Burgundy.

While I’m confident/optimistic we have not seen THE top in the equity markets, this past week’s cross asset movements were nothing short of historic and provide a fascinating tease (not necessarily in a good way) of what’s coming.
For those of us who have been highly skeptical of the underlying strength of the economy and resilience of risk assets, that skepticism was proven to be warranted these past few weeks. Given the global landscape, though, that shouldn’t be an enormous surprise. The domestic dynamic is an absolute mess across the political realm, and the monetary and fiscal policy landscape is equally compromised because of all of the political uncertainty. The FOMC clearly wants to cut rates and will in 2H 2024, starting with at least 25bps in September (more likely 50bps), and how much beyond that is both a function of economic indicators and politics.
The US economy is weakening for all of the reasons that are in plain sight, which include (but are not limited to):
- inflation and excess spending has eliminated all of the post-COVID consumer cash buffers for all brackets except the wealthy
- employment is weakening, curtailing/eliminating all upward wage pressures
- high nominal interest rates are severely affecting monthly cash flows of already overleveraged consumers
- corporate margins are at historically high levels and have nowhere to go but flat/down, reducing a potential engine of future growth
A rising equity market and high interest rates on cash have provided a confidence boost to the wealthy and baby boomers/retirees, which (in my opinion) is the main reason the travel industry hasn’t seen a slowdown yet. But as we’ve seen in the past, that relatively healthy travel dynamic isn’t exactly a reliable harbinger of future economic activity.
Over the next few months, here’s what I’m expecting:
- Unbelievable volatility, the likes of which we haven’t seen since the COVID shocks. The VIX traded at 29 on Friday, which simply isn’t something you see very often historically. The severity of the volatility, however, was even worse in other assets (JPY carry trade unwinds are historically incredibly painful). Below are a few examples, but my suspicion is there will be more anecdotes later in August/September.
- The 30yr UST had its 3rd most extreme close outside of its daily BB in the past 20 years; one day in November 2008 (obvious) and February 2013 (during the European debt crisis) were the two most extreme. Not a single COVID day was in the top 10 (including the day US bond yields traded negative). While there should be an enormous retrace mid-week once things settle down a bit, historically this is what happens at the beginning of a trend, not the end.
- Japan’s TOPIX closed down nearly 5% on Friday, the largest decline since 2016 (worse than any COVID decline).
- In the past 10 trading sessions, the JPY has strengthened by nearly 7%, the 3rd largest move in 20+ years. The only two larger moves were the final weeks of October 2008 and early March 2020 – and as some of us might remember, neither of those larger moves were the end of a trend.
- Outperformance by large cap value stocks… and probably large tech. Simply put, large cap value stocks are going to be a safe haven as things get choppy in the coming weeks/months, and their generally simplistic businesses and (usually) cheaper valuations will provide a safe place for investor cash (as they always are). I fully expect those safe havens will be well owned. MAG7 was simply over-owned and overconcentrated until about three weeks ago, and while that level of concentration may have been justified in some regards, it was simply never practical or sustainable in the medium or long-term. But in 3 weeks, the NASDAQ 100 has corrected 12%, is now unchanged versus the March highs, and has retraced almost exactly 61.8% of the move off the April lows. The move in semiconductors is even more extreme – 22% haircut off the highs from 3 weeks ago, and SOXX closed Friday at the 200 day moving average. Whatever you think of the nominal valuation of tech stocks, they still are the only sector benefitting from a strong and cyclical growth engine and strong cash flow dynamics among the largest leaders. That didn’t change in three weeks, just all the froth was eliminated in one fell swoop. In all sincerity, it may come down to one single earnings report later this month from NVDA.
- Underperformance by financials and cyclicals. Up until – and immediately after – the FOMC meeting, everyone seemingly wanted to jump into the small cap/financial outperformance, but a ~10% decline in IWM and KRE post FOMC was the proverbial shot across the bow. Financials may appear cheap but I struggle to see the upside, especially with the well-publicized CRE defaults/write-downs and increasing consumer delinquencies. Quite simply, if the US economy is weakening as much as it seems, AND the FOMC is clearly behind the curve, small caps and cyclicals should not be outperforming.
- I’m more than a little concerned that when/as energy bottoms in the coming weeks, it’s might be for a long time. For the better part of the past 2 years, front month WTI has been in a range between ~$65 and $90, but with the exception of the spring 2022 (post Russian invasion of Ukraine), that range has actually held since early 2021 (once the economy recovered from the COVID shock). Input costs are up dramatically since pre-COVID, and the political realities are such that the US no longer has nearly as many “friends” who are significant exporters of WTI as we did 10 years ago. A weaker global economy could absolutely create conditions for lower energy prices, but the global central banking regime is steadfastly dovish at the moment, and I just don’t see significant demand side shocks out there. The supply dynamic isn’t improving, and supply from alternatives simply isn’t material enough (or reliable enough) yet. All it takes is a little supply shock in the Middle East or a political disagreement between the US and a key supplier… or both…
- I’m looking for ~3.50% in 30s before year end. The chart pretty much says it all, assuming it can break through massive resistance at 4.00%.
Further commentary below with the charts.
We have changed from an investor’s market to a trader’s market – time to buckle up.
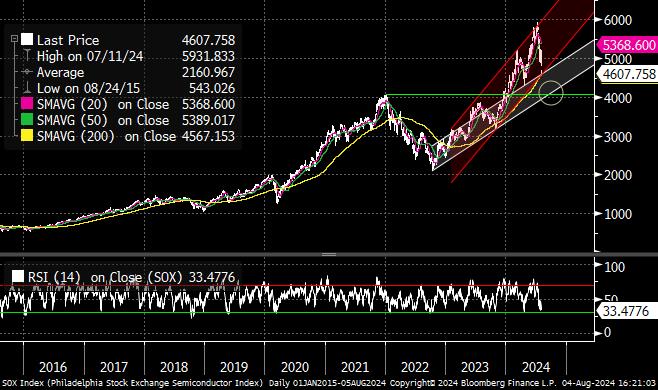
SOXX found support at its 200 day moving average and is very oversold. While I’m expecting a material bounce from here, I would not be surprised at all if we tested the ~4000 level in the coming weeks. Probably all depends on NVDA earnings end of the month.
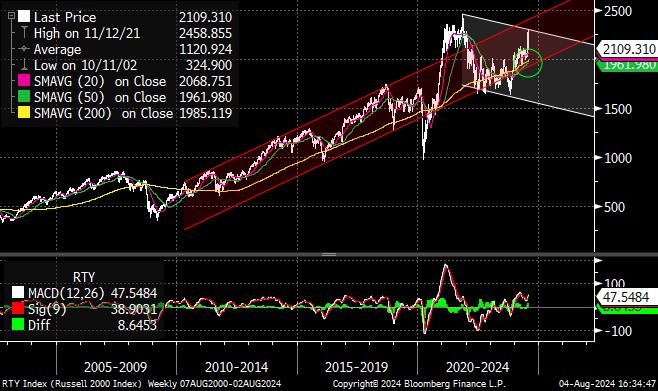
On the Russell 2000, I have long thought the lows last September weren’t durable and would be retested. We’ve obviously run significantly higher since then, but I still can’t shake that feeling. A significant move below shelf support
in the 1900-2000 range would be really bad. I’m not expecting it, for the record, at least not this year…
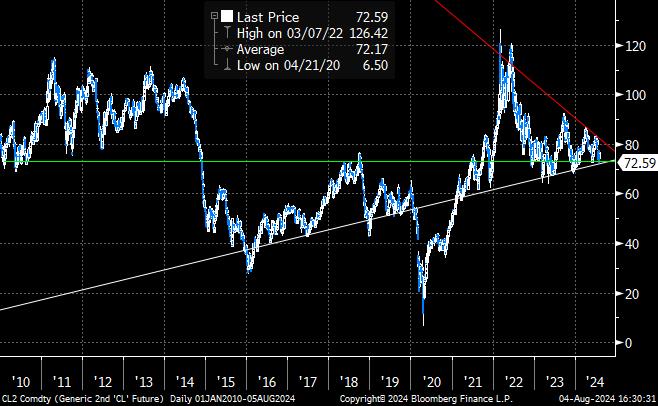
WTI is forming a MASSIVE triangle that has unbelievably dramatic consequences for the global economy whenever it decides which way to move. Excluding the COVID shock, the price of WTI has consistently been moving from lower left to upper right for a decade plus… and I can’t think of a single reason why that should change, if not accelerate.
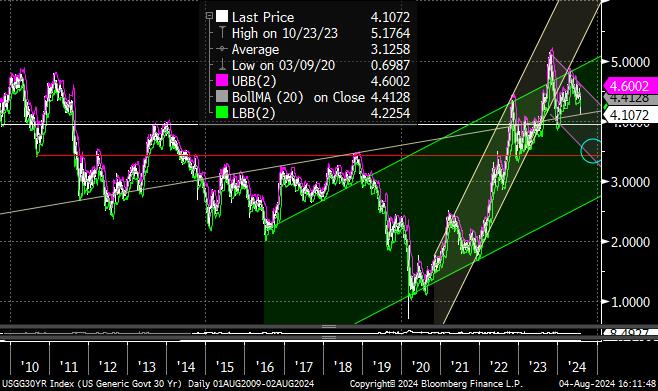
30 year USTs closed the week at ~4.10% (note how dramatic that is vs. the daily Bollinger Band low is 4.22%). Barring outright war developing in the coming days, this 4.00-4.10% area should absolutely hold as resistance on its first attempt, but given the underlying economic fundamentals, I fully expect a break later in August or September and a push towards 3.50% before year end, potentially before quarter end.