I really didn’t want to write this. I truly didn’t.
But the market action the past month – and the past few days, in particular – has forced my hand.
I am now reasonably convinced that we have one more bullish move to all-time highs remaining in the coming years, at most. Until Wednesday, I had thought there were at least two potential bullish moves higher.
Everything changed on Wednesday afternoon.
The reaction by risk assets to the tariff announcements is the main reason my timeline for the end of the bull market was pulled forward. But the underlying rationale for the bull market ending had nothing to do with tariffs and everything to do with the challenging geopolitical, economic and cyclical conditions that have developed over decades. All of these factors make me believe there’s simply not much time or favorable price action remaining for risk asset bulls. The reaction to the tariff announcements just accelerated the timeline.
Best case, we’ll get one more move higher in the coming months that will gives us new all-time highs in INDU, maybe SPX, unlikely NDX. The back half of 2025 is likely going to be very challenging, and then maybe we’ll have one final final move higher into next year. After that, the setup for the remainder of the decade gets even more challenging.
There are a myriad of reasons for this, but as someone who appreciates economic history, notice where we are in the a typical 80-100 year multi-generational cycle: 1770s, 1860s, 1930s/1940s, and now. Each time frame fits the multi-generational cycle of significant disruption in the USA. There are a number of very highly acclaimed authors and historians who have opined and written extensively on this topic, including Neil Howe, Martin Armstrong, and Ray Dalio. Nearly all of them have coalescing views on significant forthcoming disruption with his own unique perspective.
If you don’t believe the historians and want to focus on hard data, here are some that I’m watching:
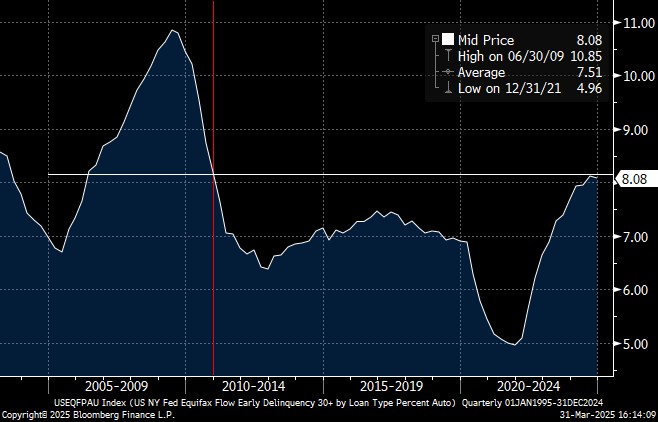
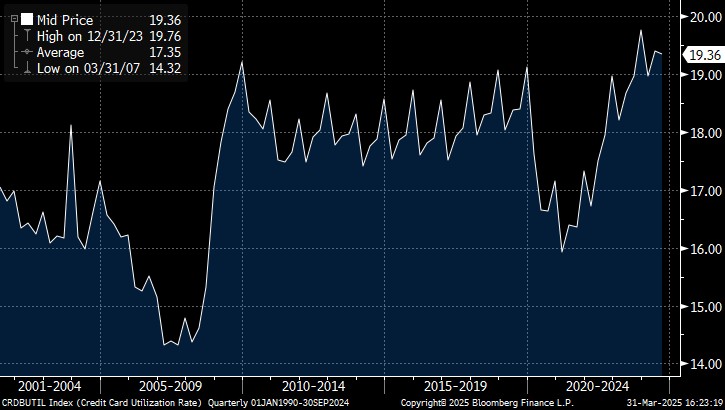
— US unemployment is near cyclical lows, supported by years of historically unsustainable large fiscal budget deficits (which I’ve highlighted ad nauseum for months). Yet early delinquencies on auto loans (Chart 1 below) are sitting at year end 2010 levels – more consistent with post-recessionary asset quality… all while credit card utilization rates sit near 25+ year highs (Chart 2).
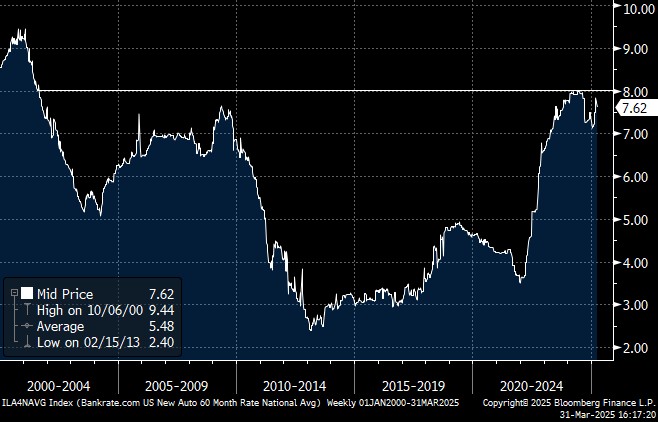
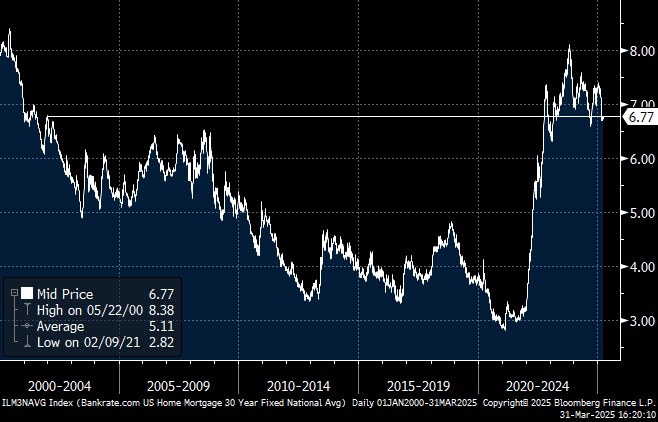
— By and large, financing rates are at multi-decade highs (Charts 3 and 4). Auto loan financing rates are higher than any point since before 9/11. 30yr mortgage rates have ticked down from nearly 8% in late 2023, but we’re still above 2002 levels. And yet even with the economy weakening and unemployment on the verge of imminently rising, the FOMC is challenged to cut rates because of inflationary pressures.
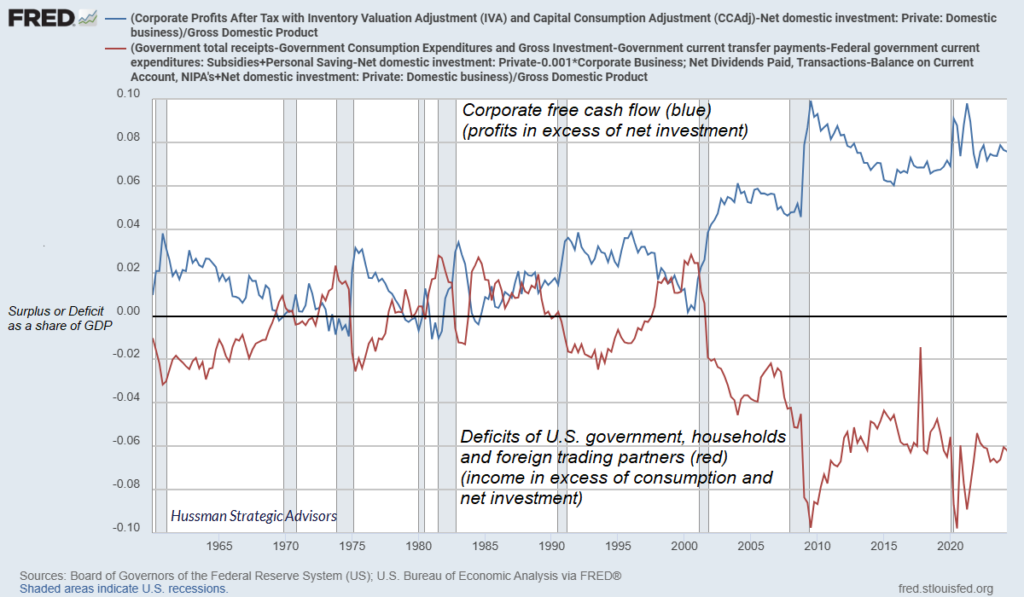
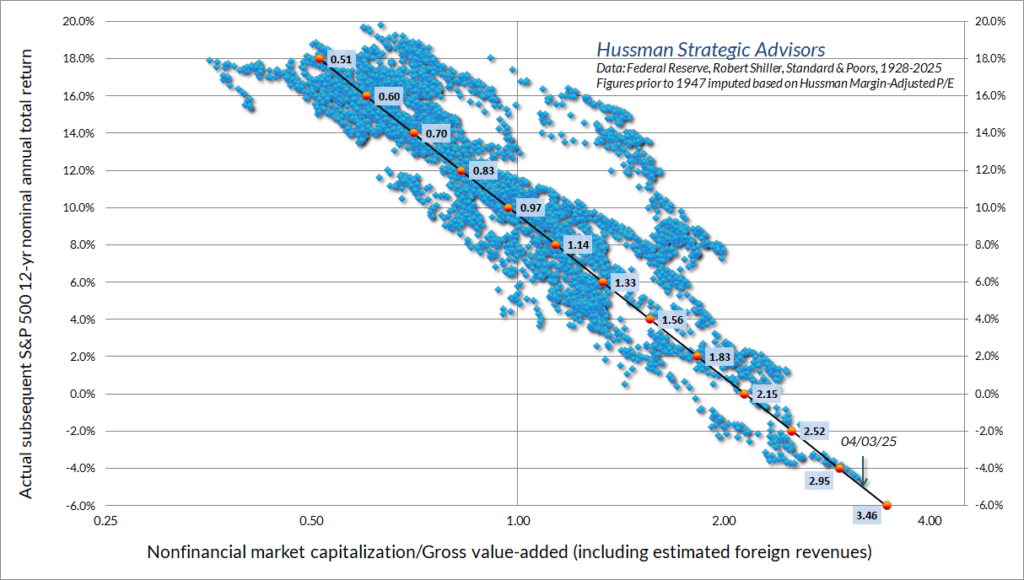
— Profit margins for publicly reporting companies in 2024 were not just near cyclical highs, they were near all-time highs, not surprisingly during a period when the federal deficits were at extremes (Chart 5). And yet valuations relative to “gross value added” are as elevated and dangerous as any period in recent history (Chart 6 courtesy of John Hussman).
With all that in mind…
1. How do we shrink significant fiscal budget deficits without resulting in material unemployment that inevitably bleeds into consumer and commercial asset quality?
2. If we choose not to proceed with fiscal deficit cutting, does the bond market revolt and crimp any ability to reduce financing costs?
3. How does the FOMC meaningfully cut financing costs with the existing inflationary pressures without a recession?
4. How do profit margins and price multiples in US equities remain elevated under all of these underlying fundamental juxtapositions?
None of those questions are simplistic to answer on their own, but they’re increasingly challenging to answer together… because I cannot point to a time period in recent US history where all of these dynamics have been in play together. There’s simply no other period to examine where one could conclude “here’s how markets reacted and how we resolved the issues.”
Beyond that, it is also abundantly clear that the current political dynamic is going to steer the US economy away from the financialization and consumer-driven landscape that has existed for the past 30-40 years and more towards industrialization, all while we’re in a deglobalization phase. I’ve written about the end of deglobalization before and what it meant for inflation and interest rates, but attempting to steer the massive US economic ship toward less reliance on a consumer-focused and financially based GDP towards industry and production is going to take years/decades and an ENORMOUS amount of capital reallocation… and massive disruption.
In many ways, what is beginning now was always inevitable… the post COVID economy was a fake one, papered over by unsustainable government deficits and enormous wealth disparity. Eventually that was going to end, either by choice or by force (civil unrest or by the market). For now, the pathway determined by our political leadership is by choice – whether that proves to be successful or not will only become self-evident many, many years from now.
With all of this in mind, I have concluded that it is time for me to start a new macro fund – the Coreview Strategic Macro Protection Fund – that will seek to not only protect hard-earned capital from the coming historical disruptions, but also cautiously and carefully profit from them. I both fear and believe these next 5+ years are likely to be the most volatile and destructive any of us will have seen in our lifetime – which is saying quite a bit considering I covered financial institutions in fixed income capital markets for a failed bank in 2008. It is time to prepare for it, and we must also be unafraid to generate profits from it.
Below are some charts on the current environment and some near-term perspectives…
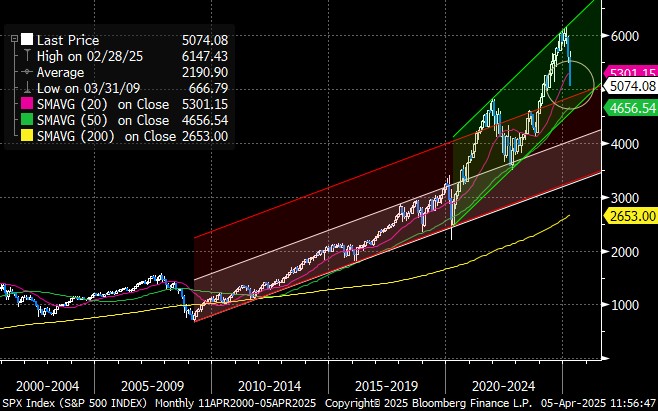
· It is easy to see on the 25-year S&P 500 chart how precarious it is for equities. We convincingly traded below the 20-month moving average, which forecasted risk asset difficulties when it was broken in April 2022. The 50-month moving average is another ~400 points below Friday’s close, and it is not out of the realm of possibility of being tested this week. I think it’s a given we’ll see it later this year, potentially later this quarter.
· There’s a part of me that looks at the S&P monthly chart and thinks “I wonder if the entire move up from October 2023 to earlier this year was a blow-off top and we’re just retracing all of that exuberance.” Touching the 50-month moving average on this first move down off the top would effectively do that.
· In the very near-term, bulls have technicals working in their favor that highly likely will provide a multi-week bounce of significance once the market bottoms (likely this week).
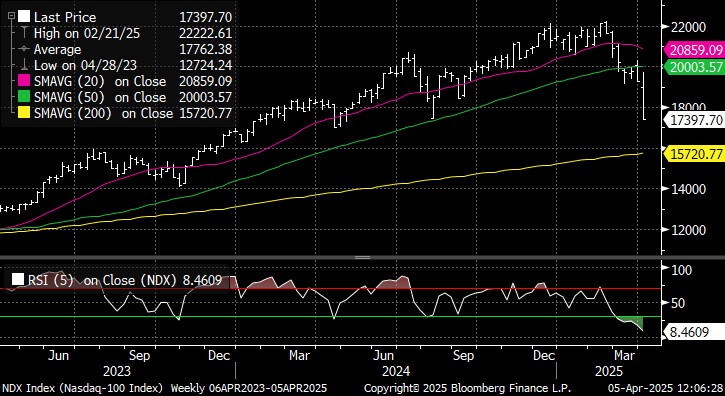
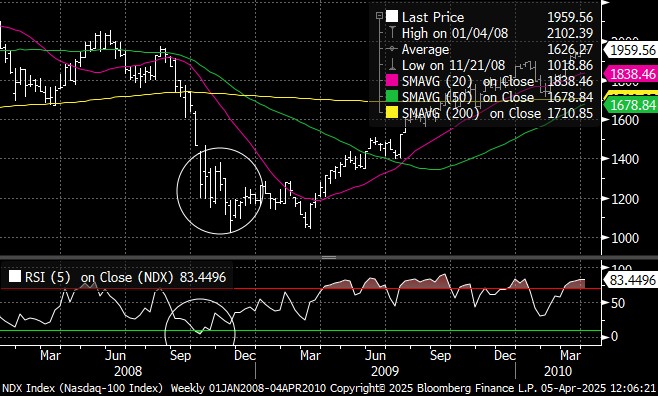
o NDX’s 5 week RSI closed Friday at 8.46 (Chart 2 below). That is the 3rd lowest reading in the past 30 years, eclipsed only by two horrible weeks in October 2008. I remember October 2008 rather vividly – are things really worse now than they were then? Of course not. And we’re more oversold now than at any point during the tech selloff in 2000-2001.
o If you go back and compare October 2008 (Chart 3) to now, purely looking at RSIs, notice we did not bottom at peak RSI… but there was a 20% bounce higher from those extremely low RSIs before the ultimate low later in 2008. While I don’t think a 20% bounce is likely here, I fully expect the coming days/weeks will see a breathtaking countertrend rally, particularly in NDX and RTY… bear market bounces always are.
o Measurements of financial conditions have turned favorable the past handful of sessions due to the decline in the USD, energy/commodity prices, and UST yields. This is tremendously important for global funds, as it will start to make USD assets scan as “cheap” again relative to other global assets, particularly risk assets.
· My expectation is risk assets will largely bottom this week and we will begin a very volatile retrace higher for the balance of the month. Where we bottom is up for debate, but anywhere from 4700-5000 SPX is my guess. More a function of time than price at this point, honestly.
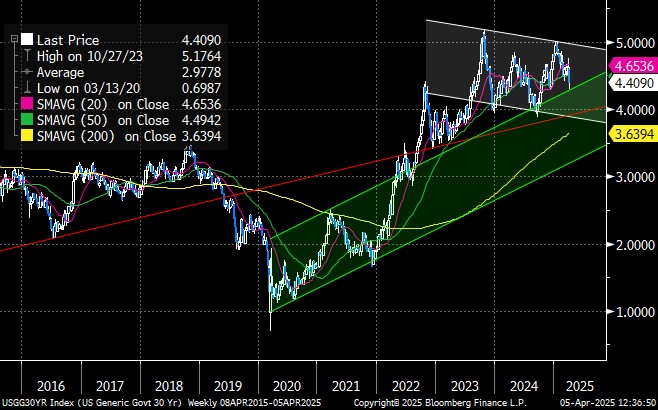
· The ~5.00% threshold in 30-year yields may end up being the cycle high for USTs, at a minimum for the next few years (I highlighted this in my January update).
o We tagged that level twice in the past 18 months – October 2023 and January 2024 – and both times, the market responded with significant buying interest for two completely different reasons.
o In October 2023, investors were so worried about inflation AND economic growth continuing forever that they simply ignored the fact that dynamic wasn’t conceivably possible. When inflationary concerns started to cool and the FOMC/US Treasury altered their net supply targets for UST bonds, everything rallied together and 5% held.
o In January 2024, investors were so worried that economic growth and Trump budget deficits were both going to the moon that they simply ignored the fact that wasn’t conceivably possible. Now we have more uncertainty and concerns around DOGE and fiscal cutting (net negative for growth), global tariffs (net negative for growth), AND economic growth is hitting the veritable brick wall. Not surprisingly, 30-year USTs rallied significantly while risk assets took a dive.
o Regardless of what happens with tariffs and economic growth in the coming quarters, I cannot fathom a scenario where that 5% threshold breaks to the upside in 2025, potentially for the rest of the decade.
o I’m also not convinced we spend much time below 4% this year, potentially a dip into the 3.75-3.90% area, but this feels very much like a range bound market the balance of 2025. And considering we’re sitting at 4.40% right now, I’m honestly pretty indifferent on long USTs at the moment, though I sure as heck wouldn’t short ‘em. A move back towards 4.65-4.75% would have me very interested from the long side.
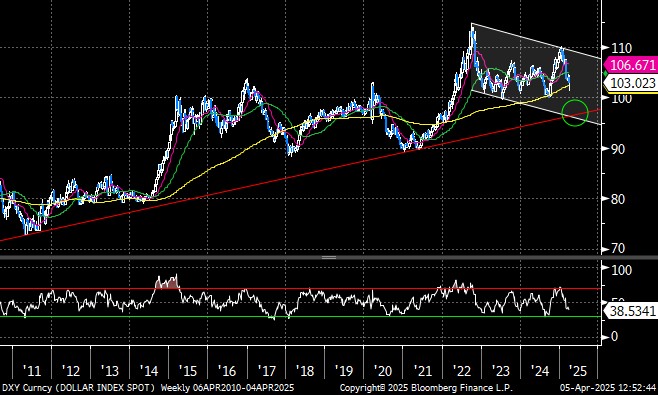
· This comment aged well from the last update… “Long USD is a very crowded trade at the moment, though I’m not quite certain when that switch flips this year. But it’s coming.”
o DXY has been pummeled the past 8 weeks for two most obvious of reasons – unwind of extreme long USD positioning and significant economic growth concerns.
o Similar to long USTs (notice the high correlation with the DXY and 30yr USTs?), I’m reasonably indifferent on the USD now – I can absolutely see continued downward pressure by another 5%, but I’m not sure I’d bet strongly against the USD relative to other currencies over the next 12-18 months.
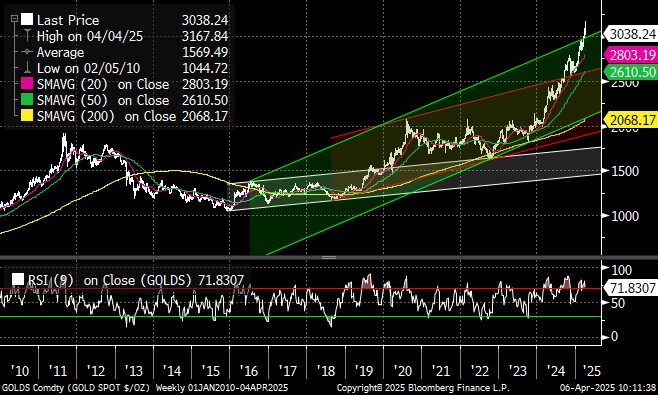
· Gold is probably close to a short-term high, or it made one last week. Doesn’t really matter, because there is nothing bearish about the gold chart or the broader macro reasons to own it. Notice the sequence of higher highs and higher lows, so any retrace is simply an opportunity to buy lower. I would not be surprised in the slightest if spot gold pulled back to test the 20 week moving average as risk assets rallied in the coming weeks, worst case the 50 week. Still bullish.
Plenty of time to prepare… but that time begins now.