I’ve been thinking about my 2025 outlook for almost 75 days, following the election results and market response in early November.
It wasn’t just the response in equities and crypto, it was across the entire spectrum of asset classes – USTs, FX, precious metals, and commodities.
There was historical precedence to support an explosion in risk assets post the election outcome in early November, namely the market reaction in 2016 to Trump’s victory, as well as the push higher late in 2017 (lead up to the corporate tax cut legislation).
It wouldn’t surprise me in the slightest if we had a bit of a euphoric blow off continue in the coming months, as I have some Fibonacci targets into the 6500+ SPX context if the bulls want to keep running. At a minimum I’m expecting higher highs this quarter, likely approaching 6200 SPX.
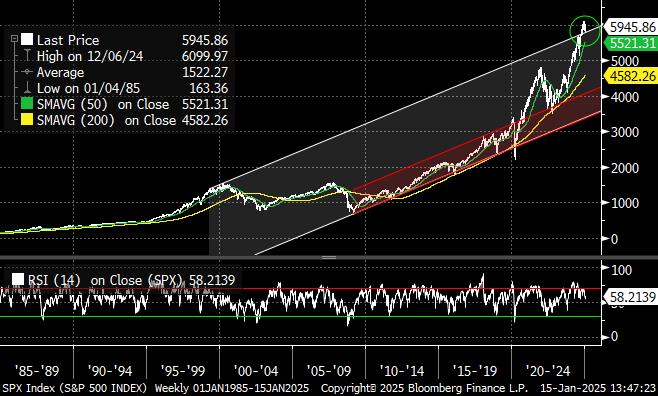
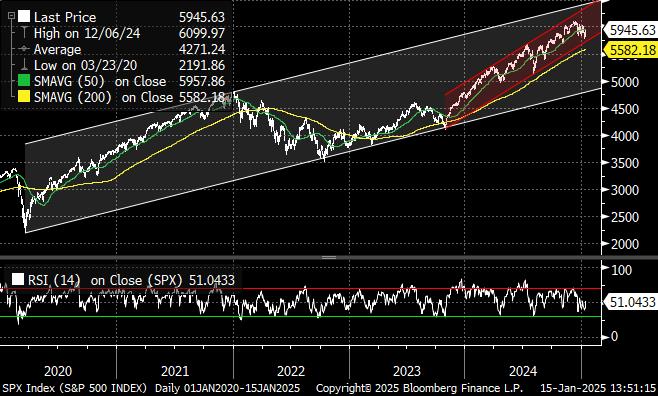
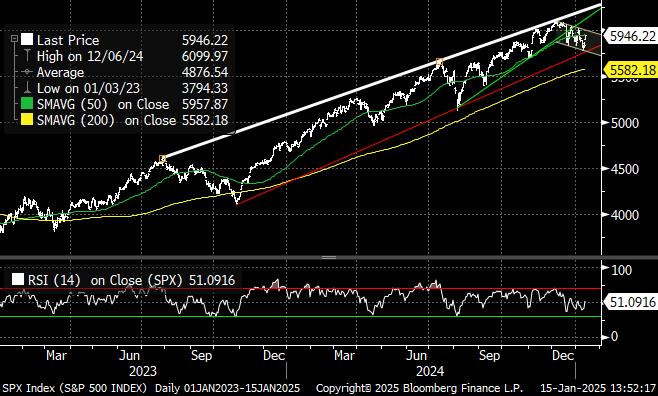
If you look at the three S&P 500 charts below, they all tell the same story – bulls have the ball until they fumble.
- The 50-week average (green line) on the 40-year chart has held repeatedly over the past few years and we are clearly in a bullish move higher, though the divergences on the weekly RSI and the acceleration outside of the 30+ year channel bear close monitoring.
- The 5-year chart shows two bullish channels that have not been breached, nor are they close to reaching peak resistance. That 200 daily moving average is major support.
- The 2-year chart shows a diagonal into the highs last year that broke down, but it has morphed into a bull flag that simply needed to fill the gap up from the November election results. Classic technical move – and doesn’t look bearish.
The trend is your friend until it isn’t, at least with regard to the major US equity indices.
That story does not translate or correlate well across many other asset classes, however, which furthers my belief that we are approaching the end of a multi-decade move higher in risk assets. I think a peak will be this year, though maybe not the peak.
The underlying fiscal, macro, and micro headwinds are starting to prove to be very formidable, and at some point later this year, they will probably overwhelm the exuberance in US equities. These are the major themes I’m focused on in 2025:
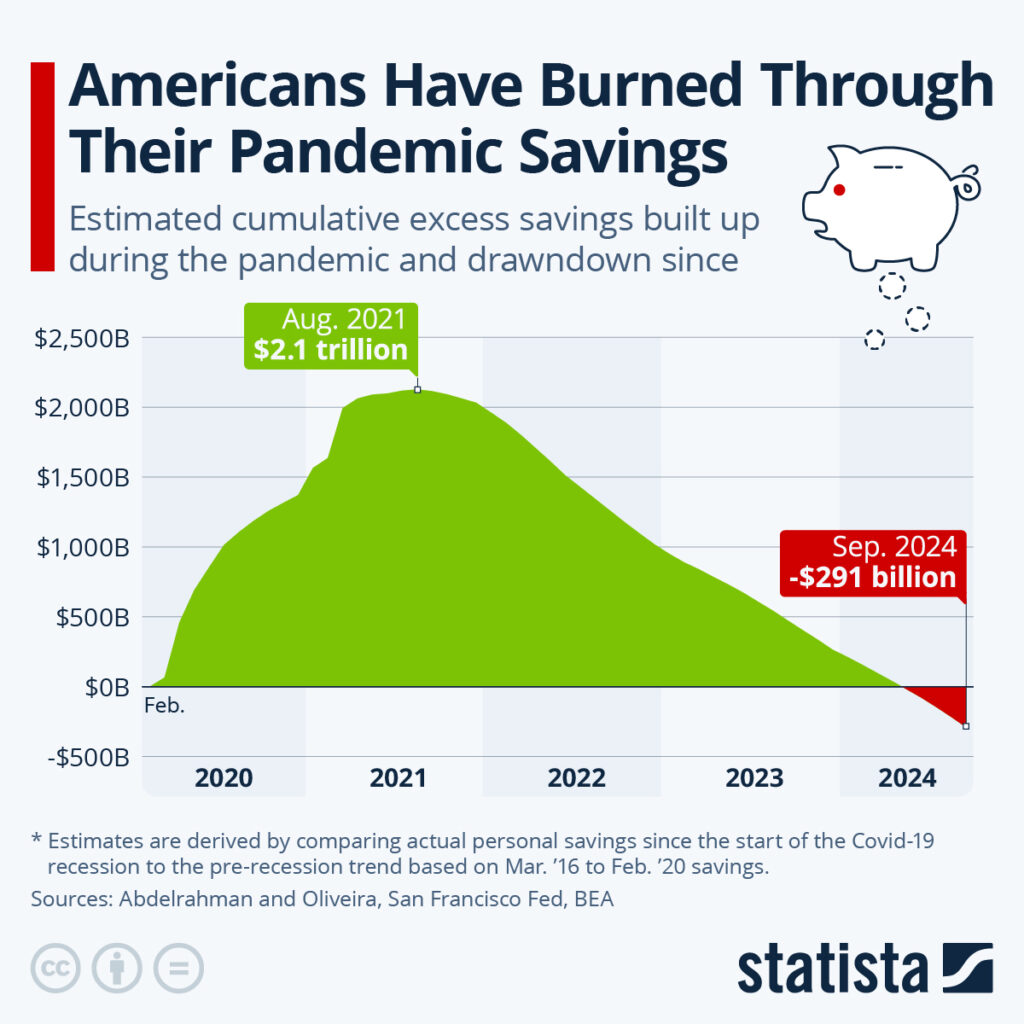
- According to Statista (story here), not only have Americans blown through their COVID savings, inflation contributed to an additional ~$300 billion (as of September) of blown savings. Many pundits will point to the record amount of assets sitting in money market funds (~$6.9 Trillion as of last week) as excess cash/savings to support the economy. While that is true, the vast majority of those money market assets are wealth assets that aren’t going to be supporting consumer spending. At some point soon, then, the expectations of further growth will no longer dovetail with reality.
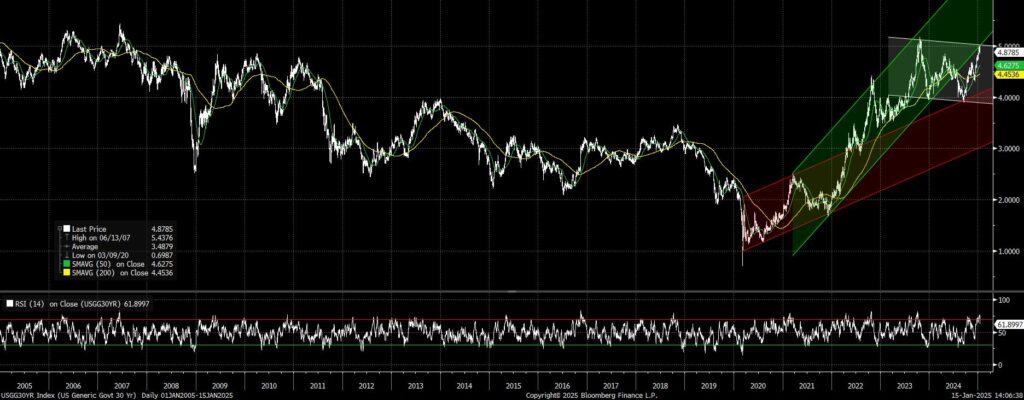
- Nominal UST yields look very much range bound, with the 30yr likely constrained between 4% and 5% for the foreseeable future (barring a growth or geopolitical shock). It certainly does not appear inflation is going to deviate much from the 2-3% band for the balance of the year, capping the number of times the FOMC is able to cut rates in 2025. The stimulus provided by the unrelenting fiscal deficits should keep term rates high due to both economic growth and increasing term premiums. Employment should wane in 2025, especially public sector employment, ensuring rates don’t run higher from here. Honestly, it wouldn’t surprise me if the ~5.00% yield we saw in 30s earlier this week turns out to be the high of the year. Keep your eye on any decrease in fiscal deficits because of DOGE or Trump’s agenda… there could be a significant and accompanying increase in public sector unemployment as a result, which is one reason I could see UST yields declining materially later in the year.
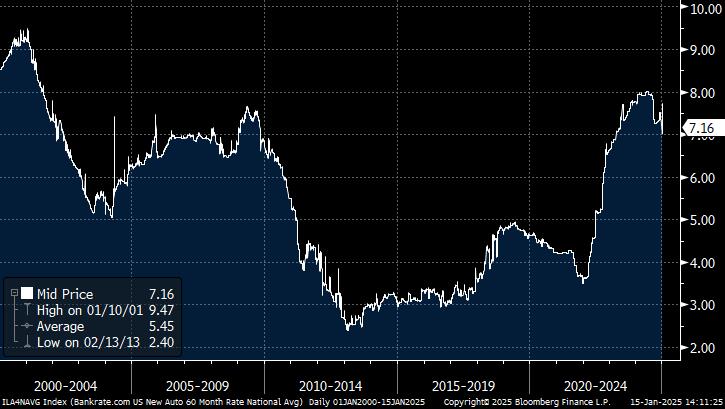
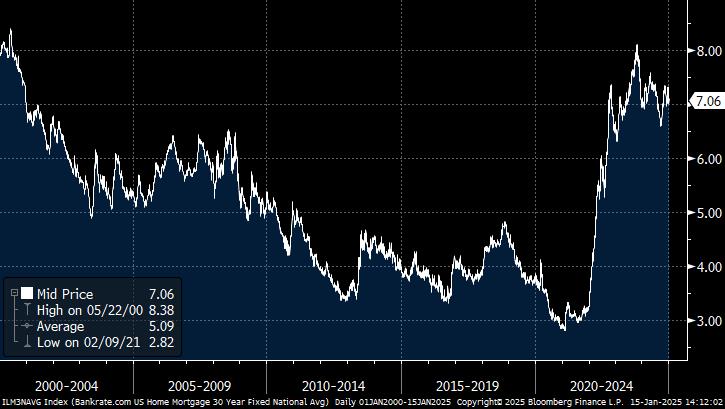
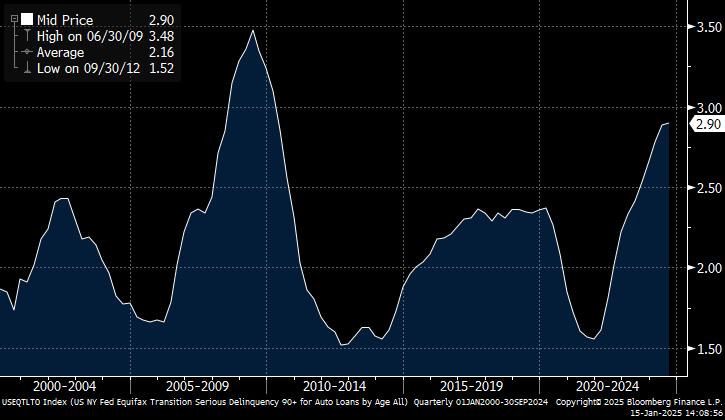
- High UST yields and Fed Funds rates are incredibly nasty for the increasingly large percentage of the population that is overburdened by various forms of leverage – e.g. credit cards, auto loans, mortgages, student loans. Financing rates (notably autos and mortgages) are simply going to be a massive hurdle for the prospective economy, especially given the current elevated levels of delinquencies. There are a few charts below that showcase this conundrum.
- If the expectation going forward is that the US economy can continue to outperform in 2025 following the election results, short-term and longer-term interest rates simply aren’t going to come down.
- Auto financing rates are at 15-year highs. Mortgage rates are at 20+ year highs. Auto loan delinquency rates haven’t been this high since 2009.
- Without being hyperbolic, we simply haven’t seen this combination of high financing rates and increasing delinquencies in decades, and there’s no logical way for this combination to resolve favorably for the US economy.
- Can delinquencies come down? Of course, but how? Where does the cash come from? Going back to the COVID savings chart, it seems unlikely the borrowers who are already delinquent or on the verge of delinquency are going to get relief from declines in inflation or interest rates anytime soon. The job market isn’t strengthening, inflation isn’t coming down, the annual federal deficit can’t go up much more than it already is… so where does the relief come from?
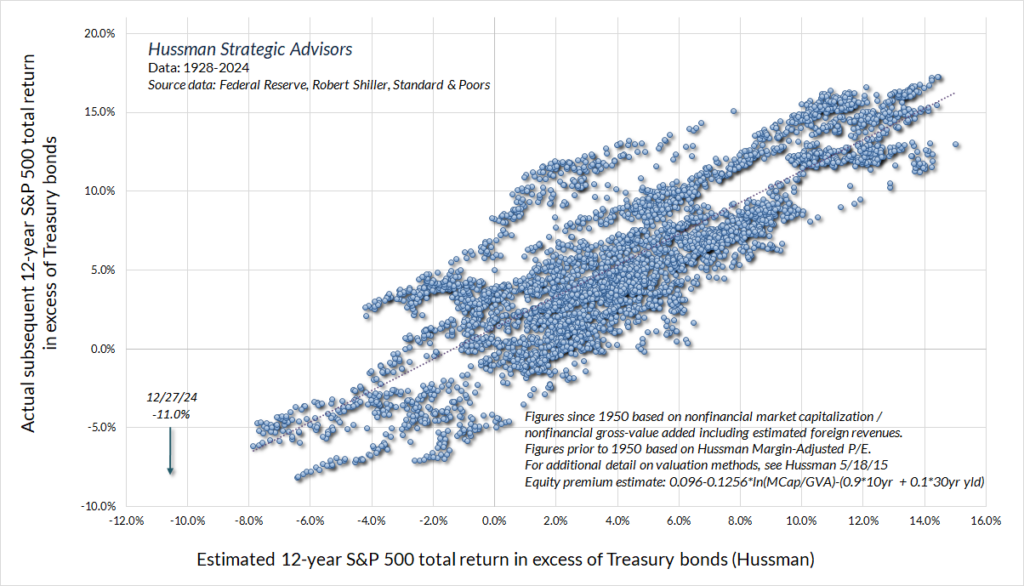
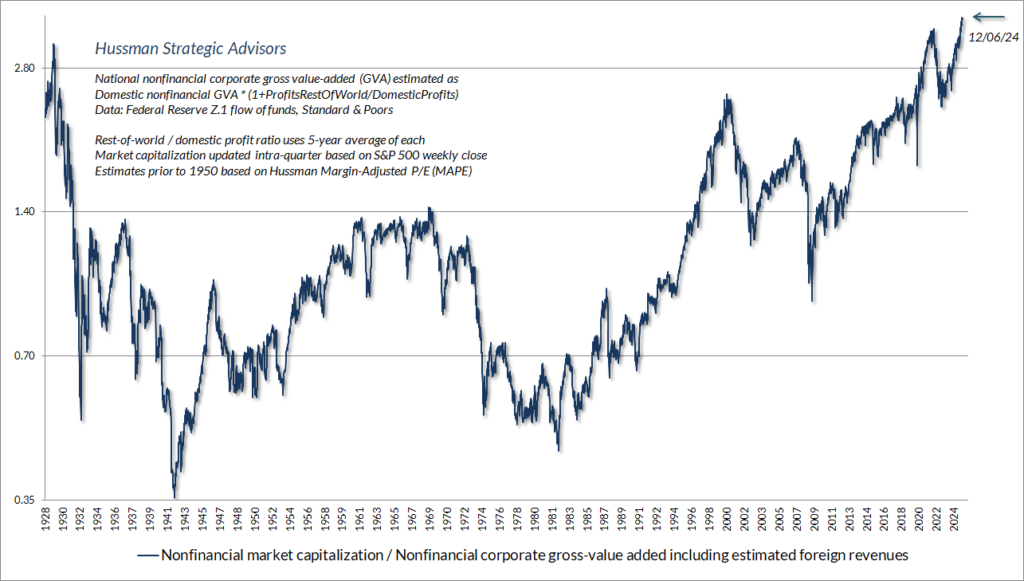
If equities were more appropriately valued in the face of these headwinds, I’d be far less concerned. But if you look at any number of historical charts on valuations, we’re well beyond even the most excessive ranges. Here are a few charts from John Hussman on valuations, with his more comprehensive commentary here.
There is one distinctive trend that I have increasingly noticed across assets recently that has me quite concerned as we move into a higher risk economic environment later in the year: the exacerbation of price movements. In the investment world that we live in now – comprised of 0DTE options, algorithmic strategies, and increasing access to high leverage, low notional investment strategies – the markets exacerbate and exhaust more so now than we have ever seen before.
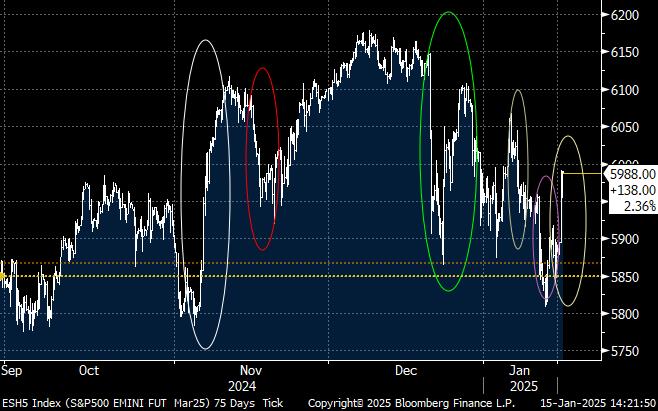
Look at this chart of the March S&P futures contract over the past ~50 days. The election outcome was the obvious move higher, followed by a significant and healthy pullback in November. But since making all-time highs in December, equities have been nothing short of manic… The FOMC was less dovish then hoped on December 18, and ES dropped ~250 points in a few hours. Two days later, PCE came in marginally below expectations and we saw ~200 point move higher in barely 6 hours. In just the first 15 days of January, two “hot” economic reports each created a ~150 point decline in a day or two, while this week’s CPI report (that barely beat) resulted in a ~150 point ES move higher in less than 24 hours.
THIS IS NOT HEALTHY BEHAVIOR.
You could certainly blame some of the December moves on illiquidity during the holidays, but not this activity in January when everyone is back at their desks. This is simply not healthy and constructive behavior in arguably the most liquid equity market in the world. And this still pales in comparison to what we saw in August last year with the JPY shock, which to me was a harbinger of what’s coming.
2025 is not going to be a bull market in any asset class – energy, bonds, equities, crypto, FX, real estate, anything.
2025 is going to be a trader’s market. “Buy and hold” probably will be fine, at least for the first half of the year. A 60/40 portfolio will probably be fine as well, especially the “40” part.
The nimble macro trader who can dive in and out of trending markets should have a phenomenal year in 2025.
